- 325Gbps / 115 Mpps SYN flood mitigated.
The attack occurred in mid-December and is one of the largest to ever be documented. - 25.3 % increase in network layer attacks from prior quarter.
A result of perpetrators preferring repeated short bursts for network layer attacks. - Longest application layer attack lasted for over 101 days.
However, the vast majority of application layer attacks lasted under 12 hours. - Increase in attacks against UK and Japanese websites.
20.7 percent increase in attacks targeting UK-based websites and a 7.4 percent increase targeting Japan-based sites.
During the second half of 2015 we witnessed a surge in the use of DDoS-for-hire services, leading to an incremental shift in the DDoS threat landscape. Most notably, Q4 saw more organizations threatened by high-volume network layer DDoS bursts. This is in contrast to the prolonged, weeks-long offensives Imperva Incapsula dealt with at the beginning of the year.
Repeated burst attacks were often used to conduct wars of attrition, with multiple attacks being launched in the span of a few hours. When used in such a manner, concurrent burst attacks are generally considered to be more dangerous than a single assault of comparable length. Countering these attacks requires a combination of early detection and rapid activation, as well as scalability. Using BGP-enabled protection, repeated burst attacks are harder to achieve than a single attack of comparable length, from a mitigation standpoint.
This quarter, we also noticed more high-volume assaults using smaller-sized network packets (e.g., TCP floods). Such assaults force operators to think in terms of processing capacity (Mpps), rather than network bandwidth (Gbps), when considering their infrastructure’s soft spots.
In using high-rate attacks, the perpetrator’s goal is to overbear network routers, switches and mitigation solutions that are not equipped to manage similarly-high Mpps loads. For instance, current-gen mitigation appliances, which may handle 4-5 Gbps, will only have a processing capacity of less than one Mpps at 64 Bytes.
Highlights
Network layer attacks
- 3 percent increase in network layer attacks from last quarter
- The largest peaked at 325 Gbps and 115 Mpps
- The longest lasted 35 hours
- 6 percent of attacks were single vector
- 9 percent were under 30 minutes
- Perpetrators prefer short burst and high Mpps attacks
Application layer attacks
- 58 percent lasted less than an hour
- The longest has lasted for 101 days (and is ongoing)
- The largest peaked at 161,300 RPS
- 7 percent of targets were attacked more than once
- 7 percent of targets were attacked more than 10 times
- 4 percent of attackers passed JS and cookie challenges
DDoS Botnet Activity
- 8 percent of attacks originated out of China
- S.-hosted websites drew 47.6 percent of attacks
- Assaults against UK-hosted websites increased to 23.2 percent
- Assaults against Japanese websites increased to 8.6 percent
- Nitol and PCRat led the chart for most commonly used malware
- Joomla! reflection attacks increased to account for 3.7 percent
Network Layer Attacks
In Q4 2015, Incapsula mitigated 3,997 network layer attacks, representing a 25.3 percent increase from the previous quarter (calculated after factoring in our user base growth).
As before, the majority of attacks were short high-volume bursts. They were best exemplified by the largest network layer assault we dealt with in Q4—a 40 minute-long SYN flood burst that peaked at 325 Gbps and 115 Mpps. This made it one of the largest DDoS attacks to date.
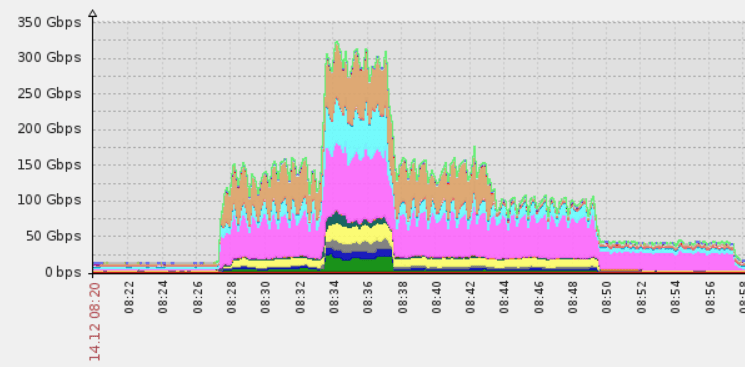 Largest network layer attack in Q3 2015, peaking at 325Gbps
This quarter, we also saw more high-rate attacks that used smaller network packets—most prominently TCP floods, used in 44.8 percent of attacks, and UDP floods accounting for 33.2 percent.
The number of single vector attacks also increased from 61.5 percent in Q3 to 75.6 percent in Q4. When combined, these stats illustrate the current evolution in network layer DDoS attacks: short-lived, concurrent, high Mpps and high Gbps single vector threats.
Attack Duration
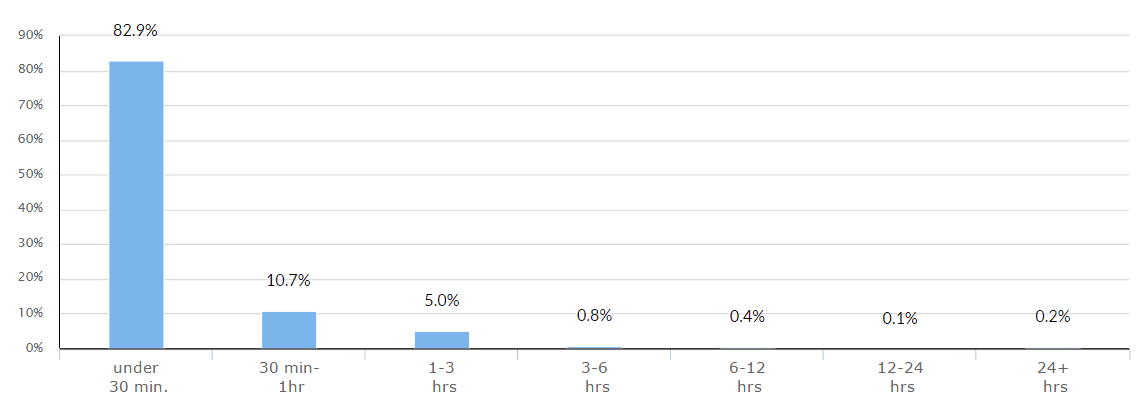 Distribution of network layer DDoS attacks, by duration
In Q4 2015, approximately 99.3 percent of all attacks against our clients lasted under six hours. Many of these, however, were part of a larger assault, during which repeated attacks were launched against the same target.
This method—using multiple short bursts to apply continuous pressure on a target—is meant to exploit the inherent weakness in many on-demand mitigation solutions. Specifically, they may require several minutes to deploy after each activation. Against these mitigation solutions, a war of attrition using short, repeated bursts is the most effective tactic for perpetrators—one which highlights the importance of time to mitigation.
As mentioned in our previous reports, burst attacks are closely connected with DDoS-for-hire (a.k.a., stresser or booter) services, which peddle rationed access to botnet resources to their subscribers. The fact that burst attacks are becoming more and more common indicates the increased use of these services.
Attack Vectors 
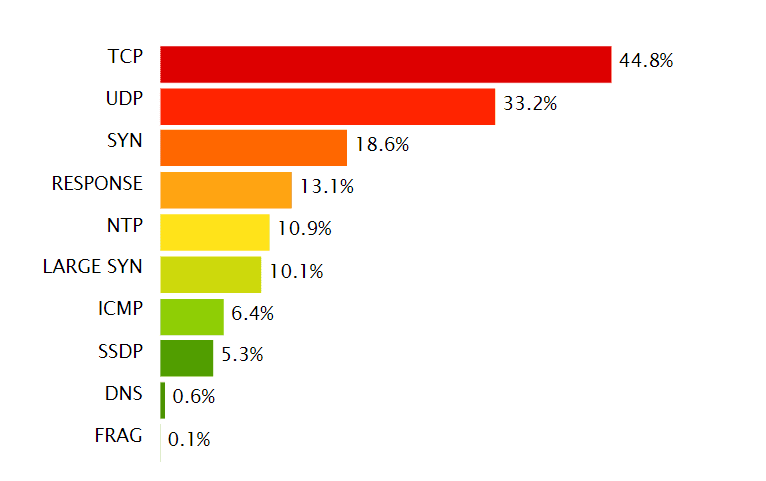
Distribution of DDoS attack vectors, by commonness
In Q4 2015, we saw a steep increase in the use of TCP flood attacks, the number of which doubled from the previous quarter. Overall, we saw perpetrators leaning more toward high rate attacks, executed using smaller packets that included SYN/TCP and UDP floods.
At higher ratios, we saw that they were used to generate high-volume attacks, similar to the above-mentioned 325 Gbps attack. The combination of high Gbps and high Mpps makes these assaults a double threat. They are also more dangerous than the reflection and amplification methods used in past years to increase DDoS attack volumes.
That the use of such methods is on the decline, while attack sizes continue to grow, points to an increase in botnet resources—enough to enable the execution of larger-than-ever, non-amplified attacks.
Multi-Vector Attacks
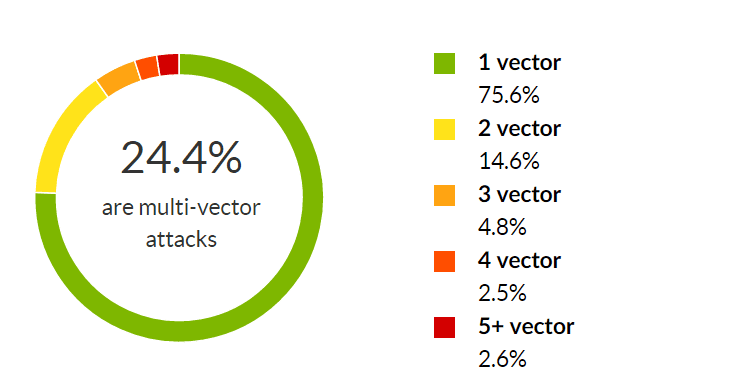
Distribution of a network layer DDoS attacks, by number of attack vectors used
For the second successive quarter we saw the amount of multi-vector attacks trending downward, to account for less than 1/4 of all network layer attacks (24.4 percent). As in prior quarters, we contribute this to the increased activity of those using DDoS-for-hire services.
While the practice of shifting between different attack vectors is still employed by more sophisticated perpetrators, last quarter the majority of assaults were single-vector threats relying on high Gbps and Mpps counts.
Application Layer Attacks
In Q4 2015, Incapsula mitigated 5,443 application layer attacks, representing a 7.1 percent decrease from Q3 2015 (calculated after factoring in our user base growth).
The largest application layer attack in Q4, peaking at 161,300 RPS, targeted a China-based online trading platform.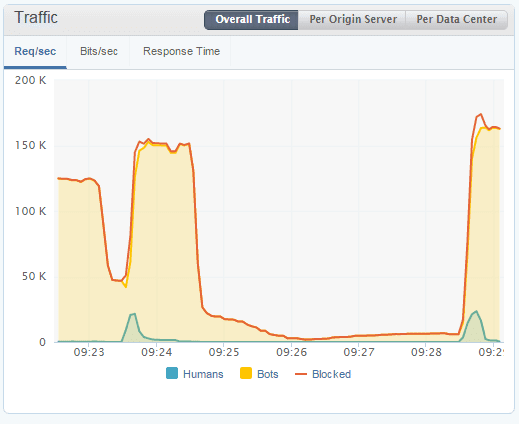
Largest application layer attack this past quarter, peaking at 161,300 RPS
The longest application layer attack lasted for 101 days (and counting). Interestingly, in this case the target was a U.S.-hosted website registered to a small catering business. Such attacks are a reminder that DDoS is a communal problem for the entire Internet ecosystem and, quite literally, every site is a possible target.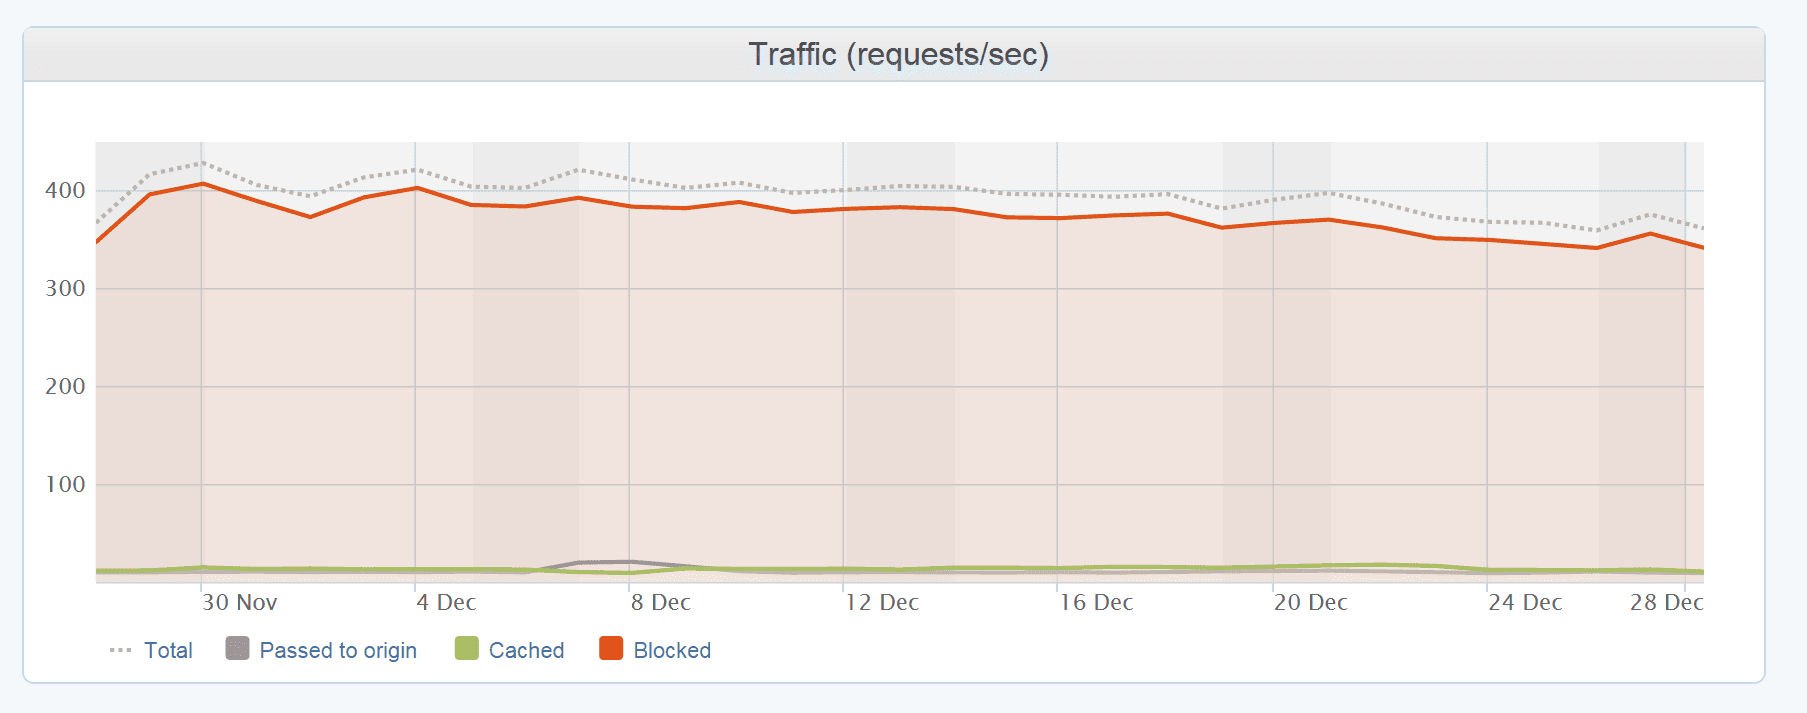
Longest application layer attack lasted for over 101 days
As with network layer threats, most application layer attacks were also short, repeated bursts. Specifically, 96.1 percent lasted under 12 hours, with 44.7 percent of targets being attacked more than once. Another 10.7 percent were assaulted more than 10 times, for an average rate of 6.8 attacks per target.
Attack Duration and Frequency
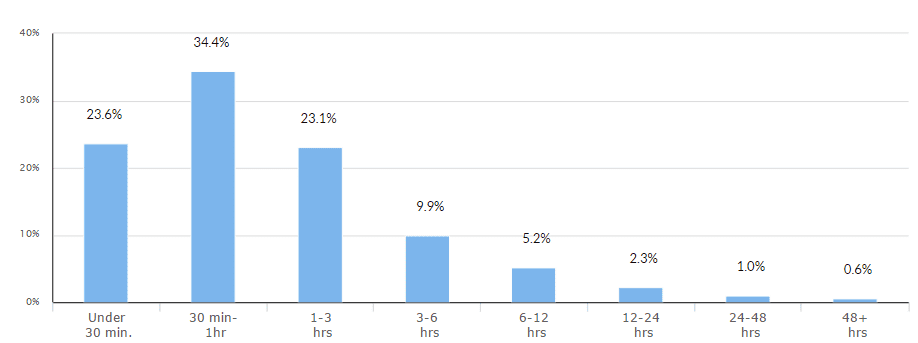
Distribution of application layer DDoS attacks, by duration
As in previous quarters, the majority of application layer attacks lasted several hours, with assaults lasting over 24 hours remaining relatively uncommon.
With regard to frequency, however, Q4 2015 saw a higher ratio of repeated attacks, which increased by 15.3 percent over Q3 2015. Part of this trend is the steep increase in targets that were assaulted over 10 times, the amount of which more than doubled from 5.3 percent to 10.7 percent.
This demonstrates the relative ease with which application layer attacks can be executed and sustained in the form of a repeated offensive. It’s worth noting, however, that mitigating concurrent application targeted assaults, which can be achieved with an always-on solution, presents less of a challenge than mitigating network layer attacks.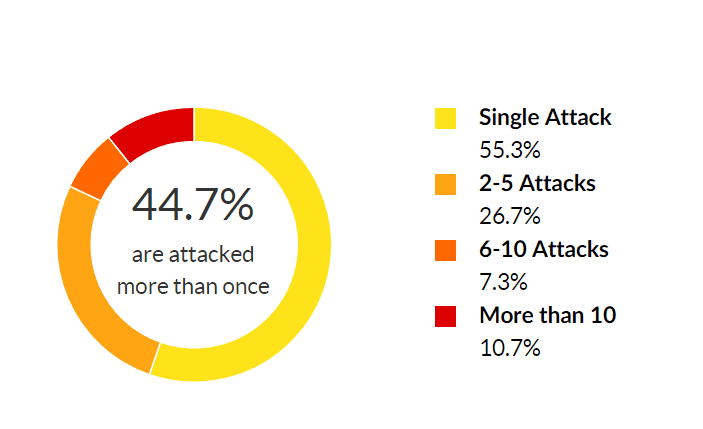
Distribution by frequency of attacks against a target
DDoS Bot Capabilities and Assumed Identities
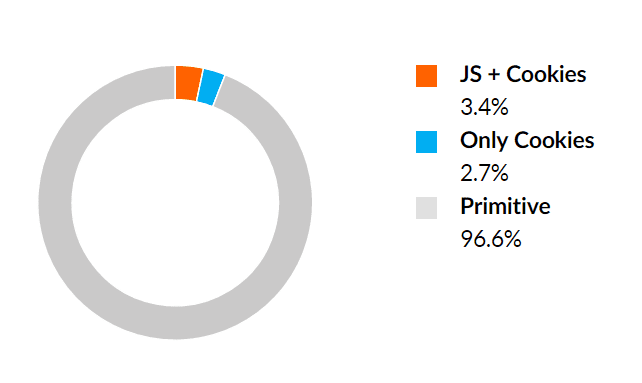
Distribution of application layer attack sessions, by bot capabilities
In Q4 2015 we noticed two countertrends, the first being a steep increase in the number of primitive bots. In the two previous quarters these amounted to close to 75 percent (74 percent in Q2 and 73.6 percent in Q3). On the other hand, we also saw an increase in bots able to bypass both JavaScript and cookie challenges—from 1.2 percent to 3.4 percent.
The prior trend points to a regression in bot capabilities, while the latter points to an increased sophistication. It’s too early to tell if this is a trend or simply a one-time shift influenced by the nature of botnets used against our clients in the prior quarter.
Assumed Impersonators
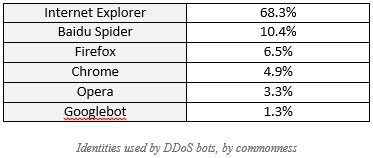
Similar to Q3 2015, in Q4 2015 we saw DDoS bots continue to masquerade as familiar browser and search engine bots. The notable addition to this roster are DDoS bots disguised as Google bot, the likes of which were common in the 2014, yet didn’t appear in any significant volumes during 2015 until Q4.
DDoS Botnet Activity
Botnet Activity and Geolocation
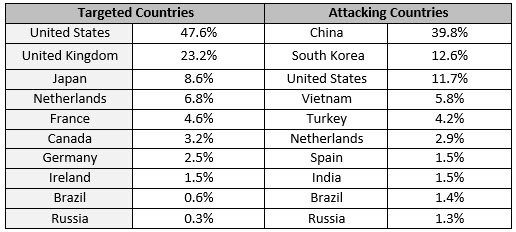
Similar to previous quarters, U.S.-based websites drew the bulk of DDoS attacks, becoming the target for 47.6 percent of all such traffic, followed by the UK and Japan—both experiencing a steep increase in the number of attacks compared to prior quarters in 2015.
In the UK, the number of assaults rose from 2.5 percent in Q3 to 23.2 percent in Q4. In Japan, that number has increased from 1.2 percent to 8.6 percent over the same period.
China, South Korea, U.S. and Vietnam continued to lead the attackers’ list, just as each had in the previous quarter.
The DDoS footprint in China was over twice as large as its legitimate traffic share, which stands at 17 percent. Likewise, both South Korea and Vietnam had abnormally high malicious traffic ratios, each accounting for approximately 0.9 percent of legitimate visits on our network, despite leading the list of the most active DDoS offenders.
Most Active Botnets
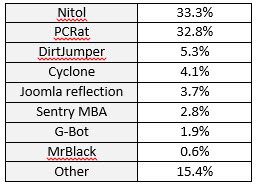
Malware types used in DDoS attacks, by commonness
When it comes to botnet malware, in Q4 2015 we saw increased activity from Nitol and PCRat botnets, accounting for 14.8 and 11.8, respectfully. Some of the Nitol variants we encountered were using Internet Explorer browser engine to bypass cookie and JS challenges.
In Q4 we also saw more activity from G-bot, pointing to an increased adoption of that malware type. We also saw DDoS offenders use Sentry MBA, a popular password-cracking tool which, at high rates, can be used for denial of service attacks.
Finally, the amount of Joomla reflection attacks continues to rise, from 0.7 percent in Q3 to a significant 3.7 percent in Q4.
[su_box title=”About Imperva®” style=”noise” box_color=”#336588″]![]() Imperva® (NYSE:IMPV), is a leading provider of cyber security solutions that protect business-critical data and applications. The company’s SecureSphere, Incapsula and Skyfence product lines enable organizations to discover assets and risks, protect information wherever it lives – in the cloud and on-premises – and comply with regulations. The Imperva Application Defense Center, a research team comprised of some of the world’s leading experts in data and application security, continually enhances Imperva products with up-to-the-minute threat intelligence, and publishes reports that provide insight and guidance on the latest threats and how to mitigate them. Imperva is headquartered in Redwood Shores, California.[/su_box]
Imperva® (NYSE:IMPV), is a leading provider of cyber security solutions that protect business-critical data and applications. The company’s SecureSphere, Incapsula and Skyfence product lines enable organizations to discover assets and risks, protect information wherever it lives – in the cloud and on-premises – and comply with regulations. The Imperva Application Defense Center, a research team comprised of some of the world’s leading experts in data and application security, continually enhances Imperva products with up-to-the-minute threat intelligence, and publishes reports that provide insight and guidance on the latest threats and how to mitigate them. Imperva is headquartered in Redwood Shores, California.[/su_box]